-
About
Marist University Summer Preview Days
Get a firsthand look at life at Marist University during our Summer Preview Days! These events are designed to help you explore campus, connect with our community, and better understand the admissions process. Summer Preview Days will be held July 29, August 14, and August 17.
About
-
Academics
Marist University Summer Preview Days
Get a firsthand look at life at Marist University during our Summer Preview Days! These events are designed to help you explore campus, connect with our community, and better understand the admissions process. Summer Preview Days will be held July 29, August 14, and August 17.
Academics
-
Admission & Financial Aid
Marist University Summer Preview Days
Get a firsthand look at life at Marist University during our Summer Preview Days! These events are designed to help you explore campus, connect with our community, and better understand the admissions process. Summer Preview Days will be held July 29, August 14, and August 17.
Admission & Financial Aid
-
Student Life
Marist University Summer Preview Days
Get a firsthand look at life at Marist University during our Summer Preview Days! These events are designed to help you explore campus, connect with our community, and better understand the admissions process. Summer Preview Days will be held July 29, August 14, and August 17.
Student Life
- Athletics

Bureau of Economic Research
School of Management
Marist University's Bureau of Economic Research
Housed within the Marist School of Management, the Bureau of Economic Research releases reports each year regarding different aspects of the Hudson Valley economy, including household income, income tax analysis, commuting patterns of workers, migration, and overall employment and wages. The Bureau also conducts economic impact studies, as well as forecasting and policy analysis.
Dr. Christy Huebner Caridi and Dr. Jin Lau are the Directors.
Media queries: To interview Dr. Caridi or Dr. Lau, please contact Anthony Proia, Director of Media Relations, anthony.proia@marist.edu.
Reports
The Bureau of Economic Research produces data-driven reports that examine economic conditions and selected policy-related topics. These reports are intended to present economic information in a clear and accessible manner for interested readers, including members of the campus community and external audiences seeking insight into the Hudson Valley economy.
Charts
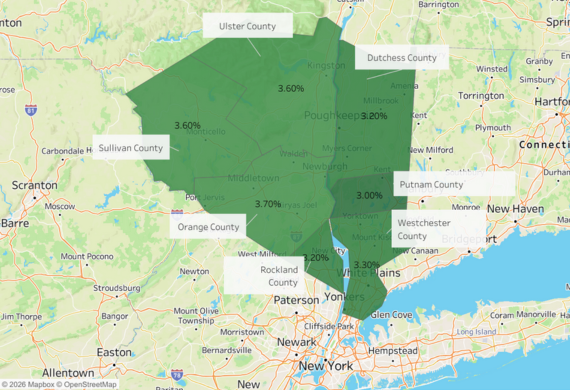
The Bureau presents economic indicators through clear and straightforward visualizations. Charts illustrate patterns across selected economic measures, helping users explore changes in the Hudson Valley economy and compare trends across counties and over time.
Newsletter and Papers
The Bureau also shares its work through newsletters and working papers developed by Marist students and faculty. They provide opportunities for students to engage with data, research, and writing under faculty guidance, and are intended for readers interested in economic issues.
Reports
This report examines total household income in the Hudson Valley with county-level details. Download the full report.
This report examines emplyment trends in the Hudson Valley. Download the full report.
This report examines the commutation trends in the Hudson Valley. Download the full report.
This report examines total household income in the Hudson Valley with county-level details. Download the full report.
This report examines income distribution in the Hudson Valley with county-level detail and statewide comparisons. Download the full report.